Approximate valuation approaches – Lesson 5
Sponsored ads:
Average growth approximation: Assuming that two stocks have the same earnings growth, the one with a lower P/E is a better value. The P/E method is perhaps the most commonly used valuation method in the stock brokerage industry.
By using comparison firms, a target price/earnings (or P/E) ratio is selected for the company, and then the future earnings of the company are estimated. The valuation’s fair price is simply estimated earnings times target P/E. This model is essentially the same model as Gordon’s model, if k-g is estimated as the dividend payout ratio (D/E) divided by the target P/E ratio.
Constant growth approximation: The Gordon model or Gordon’s growth model is the best known of a class of discounted dividend models. It assumes that dividends will increase at a constant growth rate (less than the discount rate) forever. The valuation is given by the formula:
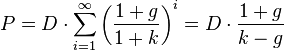 .
.
and the following table defines each symbol:
Sponsored ads:
| Symbol | Meaning | Units |
|---|---|---|
 |
estimated stock price | $ or € or £ |
 |
last dividend paid | $ or € or £ |
 |
discount rate | % |
 |
the growth rate of the dividends | % |
Limited high-growth period approximation: When a stock has a significantly higher growth rate than its peers, it is sometimes assumed that the earnings growth rate will be sustained for a short time (say, 5 years), and then the growth rate will revert to the mean. This is probably the most rigorous approximation that is practical.
While these DCF models are commonly used, the uncertainty in these values is hardly ever discussed. Note that the models diverge for  and hence are extremely sensitive to the difference of dividend growth to discount factor. One might argue that an analyst can justify any value (and that would usually be one close to the current price supporting his call) by fine-tuning the growth/discount assumptions.
Implied Growth Models
One can use the Gordon model or the limited high-growth period approximation model to impute an implied growth estimate. To do this, one takes the average P/E and average growth for a comparison index, uses the current (or forward) P/E of the stock in question, and calculates what growth rate would be needed for the two valuation equations to be equal. This gives you an estimate of the “break-even” growth rate for the stock’s current P/E ratio. (Note : we are using earnings not dividends here because dividend policies vary and may be influenced by many factors including tax treatment).
Sponsored ads:
Imputed growth acceleration ratio
Subsequently, one can divide this imputed growth estimate by recent historical growth rates. If the resulting ratio is greater than one, it implies that the stock would need to experience accelerated growth relative to its prior recent historical growth to justify its current P/E (higher values suggest potential overvaluation). If the resulting ratio is less than one, it implies that either the market expects growth to slow for this stock or that the stock could sustain its current P/E with lower than historical growth (lower values suggest potential undervaluation). Comparison of the IGAR across stocks in the same industry may give estimates of relative value. IGAR averages across an industry may give estimates of relative expected changes in industry growth (e.g. the market’s imputed expectation that an industry is about to “take-off” or stagnate). Naturally, any differences in IGAR between stocks in the same industry may be due to differences in fundamentals, and would require further specific analysis.
Lets learn how to Pick the right stock share – Lesson 6
Sponsored ads: